Deviation Analysis & Inspection

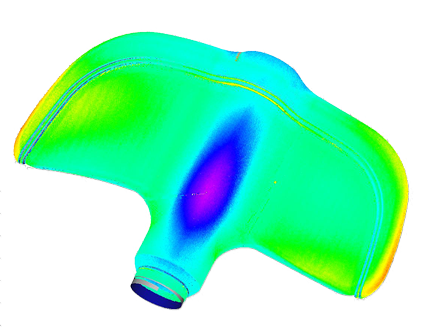
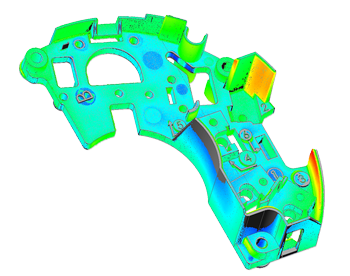
Deviation Analysis is a method of inspection that compares 3D scan data to existing CAD or other scan data. The process is also called Computer-Aided Verification (CAV) or Computer-Aided Inspection (CAI) The output of the process is often called a color map for its bright, colorful visualizations.

Deviation Analysis is an extremely cost-effective way to capture near full-coverage of any part and compare it to a known standard.

Talk With An Engineer

Story-Worthy Service. Rapid Response.

Color maps are an excellent way to visually identify sink, warp, twist and other undesirable characteristics as you evaluate your parts or tools.

This is especially useful for organic and complex shapes where traditional CMM inspection may lack coverage and point density.

For product and process development, deviation analysis using 3D scanning is very cost-effective. Without requiring full first articles on every dimension, you can quickly check the profile of your part against nominal CAD or a golden part and verify that it is within an acceptable range.

Scanning1

Scanning

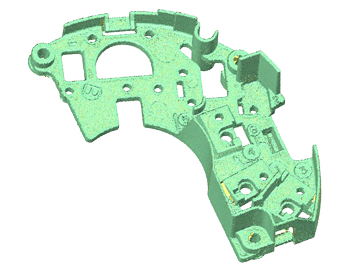
Everything begins with 3D scanning. A variety of scanning technologies can be utilized as needed given physical constraints of your part’s material, size and complexity.
Processing2

Processing

The resulting point cloud data is then processed to remove noise and ensure a clean scan.
Alignment3

Alignment

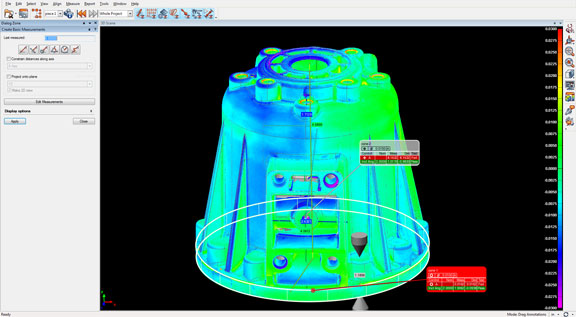
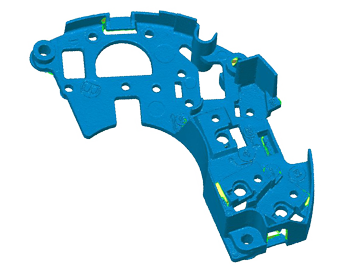
The clean scan data is aligned to the reference data and packaged as an interactive 3D report. The reference data can be an existing CAD model or an STL created from another scanned part.
Processing4

Processing

On project close, we will deliver both the 3D interactive report (with viewer software provided) and a 2D report (pdf) as determined by your project requirements.

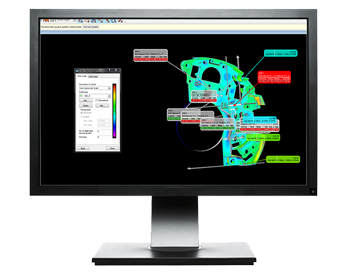
Flexible Delivery. Powerful Reports

The output of every Deviation Analysis project includes a interactive 3D report, and a powerful viewer app called IMView.  The deviation between the base and scan data can be represented in any way that is useful to you - Pass/Fail, color scales with custom range, etc. This viewer/report deliverable provides the ability for you to further interrogate the data and create custom reports in the future. Specific dimensional call outs can be taken from this report and published as a FAI data spreadsheet.  This hybrid deliverable is called a CAV Plus.
Considerations before starting a 3D Scanning project:
  • Have a good idea of how this analysis will be used.
  • Existing CAD OR a "golden part" to compare to.
  • Basic images of the part.  These will enable us to quote scanning requirements based on material, size and complexity.
  • Your reporting requirements.  Know potential for specific callouts, deviation scale, threshold, tolerances, etc.

Tell us about your project! Get a quote in less than 2 hours.  952-895-1150. 8am-5pm CST

"Not sure how to say this besides - THANK YOU for the quick turn-around! Our customer wanted a big job completed quicker than we could handle. Your group jumped right in and got it going.

We look really good to our customer and their project is rolling along nicely!"

- John W, TechNH, Inc.

Talk to a Quality Expert.

952-895-1150   8a-5p Mon-Fri, CST

QC Group, LLC. | Headquarters
5950 Clearwater Drive, Suite 300
Minnetonka, MN 55343
Get Directions | 952-895-1150

Irving, Texas
4100 W Royal Lane, Suite 125
Irving, TX 75063
Get Directions | 972-915-4333

Albuquerque, New Mexico
1451 Innovation Parkway SE, Suite 650
Albuquerque, NM 87123
Get Directions | 505-299-0975

Effective July 1, 2015, QC Group’s training division separated from QC Group, LLC and began operation as a standalone business entity, QC Training Services, Inc.

They provide individual and group training in a variety of quality and manufacturing topics.  If you are interested in these services, please contact them at qctraininginc.com.

Inquiries that we receive for training services will be forwarded.

qctraininginc.com